
Hepatocellular Carcinoma (HCC) is a leading cause of cancer related deaths worldwide. Hepatitis viral infection, alcohol/cirrhosis, genetic predisposition (inherited) are among the major risk factors for HCC development. It is considered that treatment options are available if cancer is diagnosed at an early stage and become limited if the tumor progresses to the late stage. In this project, we will try to understand which molecular mechanisms are associated with liver cancer stage classification (comparison of stage1, stage2, stage3, and stage4) and how we can differentiate various risk factors responsible for liver cancer development. How the multi-omics data integration helps us to understand the association of clinical phenotypes of samples with the omics data.
It is interesting to see what molecular changes take place among tumors based on tissue type. Thus, we want to see whether transcriptomics signatures also vary among different tissue type (e.g. Liver cancer vs. Breast Cancer). Besides, tumorous and non-tumorous samples from different cancer can be distinguished based on transcriptomics data
Towards this, first, we can compare liver cancer and breast cancer, asking the question: does tissue type or cancer (tumor) associated molecular changes play a vital role in the data?
Bioinformatics Approaches
This question can be addressed by different bioinformatics approaches. Here, we are employing two of the following methods:
- Principal Component Analysis (PCA)
- Factor Regression Analysis. (Link to Factor Regression Analysis Tutorial:)
Dataset
To address this question, we are using transcriptomics profiling data of liver cancer and breast cancer patients. Here, we are using the gene expression of all the genes (20,531) for a total 12 samples; 6 from each types of cancer (3 liver cancer primary tumor (LIHC-TP), 3 liver non-tumorous (LIHC-NT), 3 breast cancer primary tumor (BRCA-TP), and 3 breast non-tumorous (BRCA-NT)).
Data with FPKM values for 20530 genes: https://raw.githubusercontent.com/pine-bio-support/Final_Liver_cancer_project/main/Final_LIHC_BRCA_data_with_FPKM.txt
Quantile normalized data for 20530 genes: https://raw.githubusercontent.com/pine-bio-support/Final_Liver_cancer_project/main/LIHC-BRCA_QN5_data_Pipeline_LIHC_BRCA_20531_genes_FPKM_values_data_Threshold_5_normalized.txt
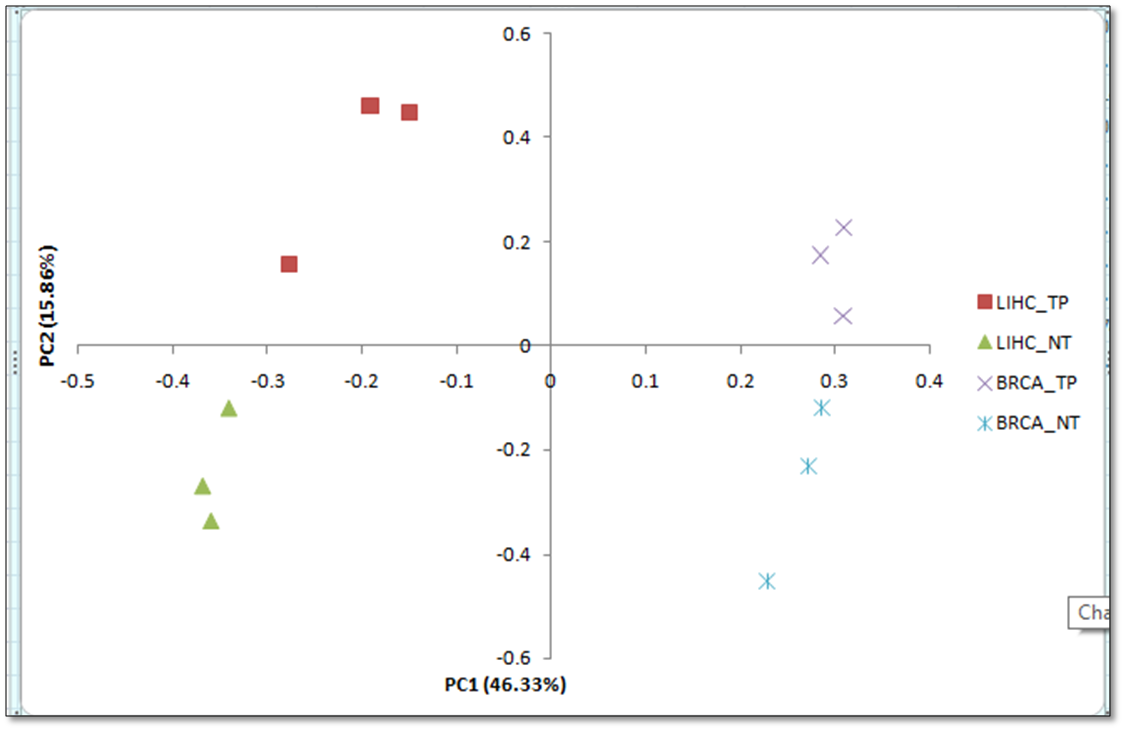
To answer the above question, first, we will use PCA (Principal Component Analysis). PCA will allow us to understand the pattern or sample distribution in our data. Here, we are taking the gene expression of all the genes (20,531) for a total 12 samples; 6 from each types of cancer (3 liver cancer primary tumor (LIHC-TP), 3 liver non-tumorous (LIHC-NT), 3 breast cancer primary tumor (BRCA-TP), and 3 breast non-tumorous (BRCA-NT)). PCA will generate the new features or principal components from the input data. Eventually, based on PCA components, we can visualize the spatial distribution of samples.
To learn more about the project, visit: https://learn.omicslogic.com/Learn/project-03-tcga-liver-cancer-precision-oncology/lesson/02-pan-cancer-analysis