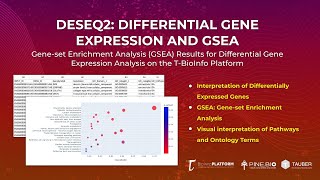
Differential Gene Expression Gene Enrichment Analysis (Output Review)
In this tutorial, you will: * Learn about various outputs that you will get after carrying out differential gene expression analysis on the T-BioInfo Platform (https://server.t-bio.info/). * Output...
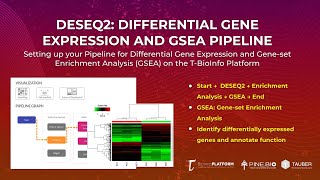
Differential Gene Expression Analysis: Gene-set Enrichment Analysis (GSEA) (Setting Up Pipeline)
In this tutorial, you will: * Learn how we can conduct differential gene expression analysis on the T-BioInfo Platform (https://server.t-bio.info/). * Project Dataset used for pipeline: Humanized m...
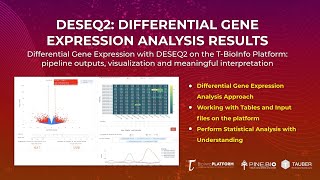
Differential Gene Expression: Bulk RNA Seq Analysis Results (DESEQ2 Output Review)
In this tutorial, you will: * Learn about various outputs we get after performing differential gene expression analysis at the end of RNA-Seq pipeline on the T-BioInfo Platform (https://server.t-bi...
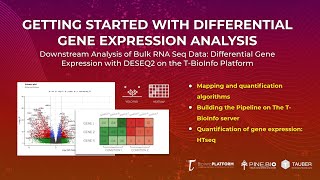
Differential Gene Expression: Bulk RNA Seq with DESEQ2 on the T-BioInfo Platform (Getting Started)
In this tutorial, you will: * Learn how to run a differential gene expression analysis at the end of a standard RNA-Seq pipeline on the T-BioInfo Platform. * Dataset used for pipeline: Humanized mi...
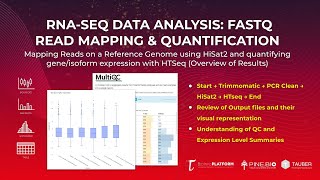
Bulk RNA-Seq Data Analysis: Mapping with HiSat2 and Quantification with HTSeq (Output Overview)
In this tutorial, you will: * Learn about the various outputs that we obtain after running an RNA-Seq pipeline on the T-BioInfo Platform (https://server.t-bio.info/). * Pipeline Workflow: Start &ra...
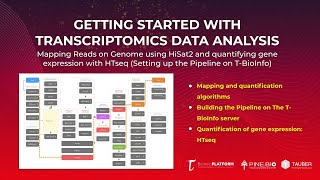
Bulk RNA-Seq Data Analysis: Mapping with HiSat2 & Quantification with HTseq (Setting up Pipeline)
In this tutorial, you will: * Learn how to set up an alternative RNA-Seq pipeline on the T-BioInfo Platform (https://server.t-bio.info/). * Dataset used for pipeline: Humanized mice with implanted ...
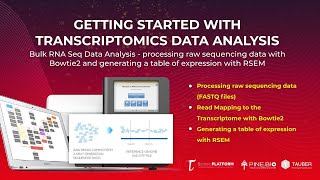
Bulk RNA Seq Data Analysis: Mapping with Bowtie2 & Generating Expression Table with RSEM
In this video tutorial, you will learn about: In this video tutorial, you will: * Learn how to prepare and run an RNA-Seq pipeline on the T-BioInfo Platform (https://server.t-bio.info/). * Project ...
ChIP-Seq Analysis
ChIP-Seq Analysis ChIP-Seq, or chromatin immunoprecipitation sequencing, is a technique that performs analysis of transcriptome data generated by next-generation sequencing technologies or by...
T-BioInfo Interface Overview
When you open the T-BioInfo platform, you will see a list of data types that correlate with different sections of the platform. As an example, we can choose the RNA seq pipeline by clicking on the ...
T-BioInfo - FTP Uploads and SVL files
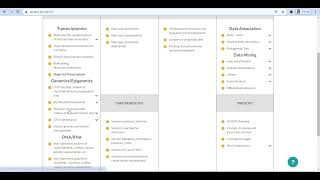
The T-BioInfo platform provides user-friendly and intuitive access to multiple standard and custom data analysis methods. These include processing various omics datasets like Genomics, Transcripto...
RNA-Seq Practical : From NGS expression table to statistical analysis on T-Bioinfo Server
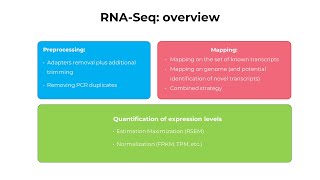
RNA-Seq (RNA sequencing) is a sequencing technique which uses NGS (next-generation sequencing) to reveal the presence and quantity of RNA in a biological sample at a given moment, analyzing the con...
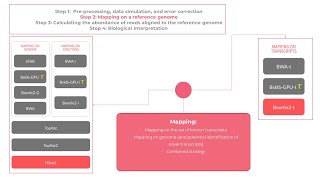
What is the fastest and most simple pipeline for RNA-seq?
RNA Seq study to interpret biological insights includes various steps but to analyse the data in simple steps, the algorithm Bowtie 2-t could be used which is an ultrafast and memory-efficient tool...
Results from the RNA-seq Pipeline
The real research and struggle begins when the pipeline is complete. The results obtained from the pipeline are to be processed, normalized and then analyzed to interpret biological insights. It is...
RNA seq on T-BioInfo
RNA-Seq is a technique that performs analysis of transcriptome data generated by next-generation sequencing technologies or by microarrays. Success in analysis of the transcriptome is largely depen...
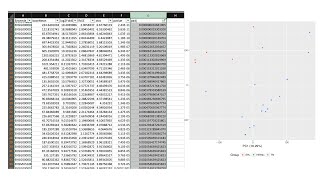
Basic PCA: making a scatterplot of Principle Component Analysis results in Excel
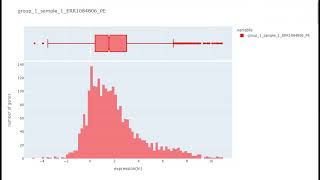
After we run a pipeline to process raw reads from the FASTQ file, we can study the gene expression table. Working with the gene expression table includes understanding our column and row names, as ...
Using PCA Draw - a different PCA on T-BioInfo
PCA identifies linear combinations of genes such that each combination (called a Principal Component) explains the maximum variance. It's often used to make data easy to explore and visualize. We l...
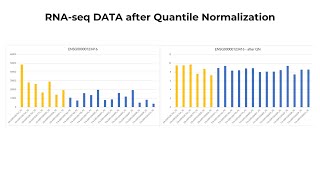
Quantile Normalization for Gene Expression (RNA-seq) on T BioInfo
Quantile normalization, and other normalization procedures are important to transform distributions between, and amongst, different samples to have the same distribution. Quantile normalization is ...
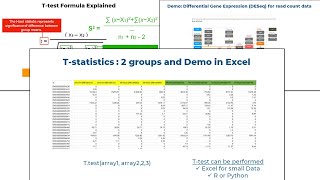
Statistical analysis: T-Test in Excel to find the differences between two groups
The way we operate with data has been changed by computers to the point that they perform certain calculations we often do not completely understand. For example, the p-value that is often used to ...
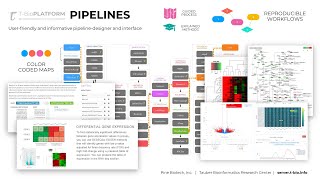
Differential Gene Expression Analysis & Biological Annotation Pipeline
There are a number of methods/algorithms that can be applied to scrutinize the significant genes from the RNA expression data. Depending on whether data is normalized or not, these methods can be a...
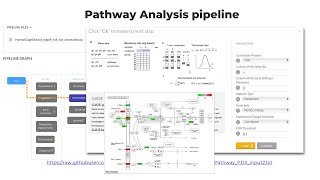
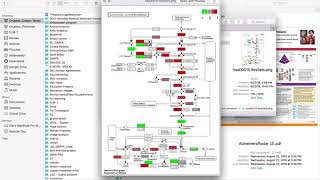
Annotation & Pathways analysis Pipeline
From the DESeq2 and GSEA analysis module, we can get important information about their biological implications. Besides, if you perform simply T-test or Use EdgeR, you will not get information rega...
Short tutorial on using T-BioInfo platform to run Gene Set Enrichment Analysis.
Gene set enrichment analysis is a method to identify classes of genes or proteins that are over-represented in a large set of genes or proteins, and may have an association with disease phenotypes....
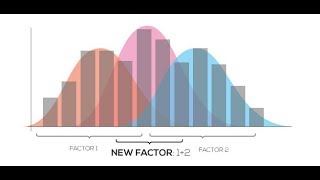
Factor Regression Analysis
When multiple factors are affecting gene expression in your project, you can utilize a regression-based method of finding the relationship between expression values and levels of factors. Regr...
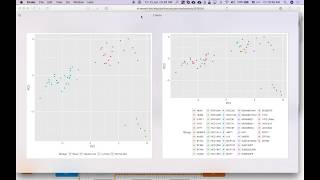
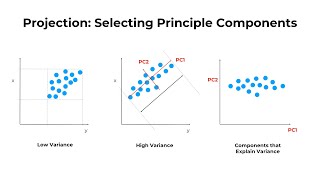
Principal component Analysis (PCA ):Tutorial
Let's begin our journey into the cell line data with a review of Principal Component Analysis (PCA). PCA is a statistical approach from linear algebra that uses a matrix of covariance to find an ef...
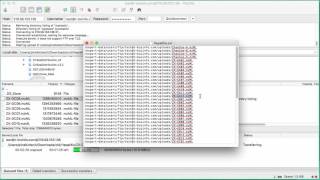
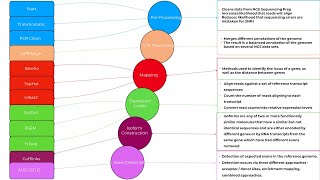
Transforming the FASTQ files into structured data
Before we can use the methods for advanced analysis, the data found in this collection has to be prepared. The main reason for this is because each one of these samples can be downloaded as a colle...
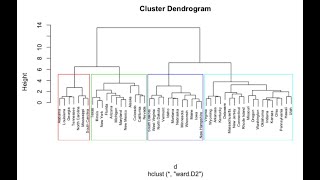
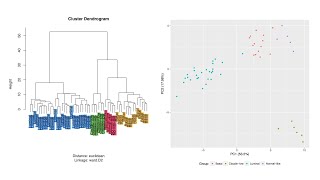
Unsupervised Machine Learning (Hierarchical Clustering)
Complex patterns in large datasets are hard to find manually. These types of data show non-linear dependencies and contain noise that makes it hard to find statistically significant differences. Th...
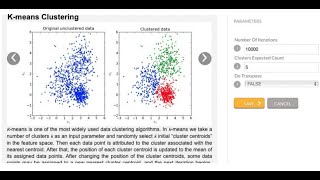
Unsupervised Machine Learning (K-Mean Clustering)
Another conventional clustering method is called k-means. In this clustering method, we take a number of clusters k as an input parameter, then randomly select k initial “centroids” in ...
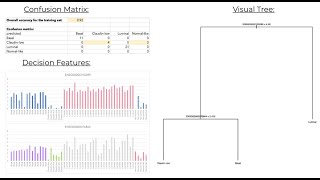
Supervised Machine Learning(Decision Tree and Random Forest)
Supervised Machine Learning is an algorithm that takes in data that is labeled – typically this is prepared by people who annotate the dataset. In biomedical projects, the annotation could be...
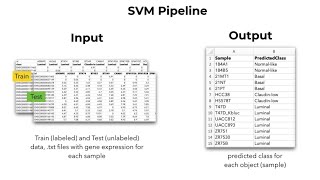
Supervised Machine Learning(Support Vector Machine (SVM))
Many times, it is not possible to have any linear discrimination and finding a quadratic function to delineate groups is practically impossible, which reduces prediction accuracy. In those cases, w...
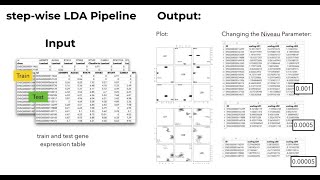
Supervised Machine Learning: Feature Selection
Feature Selection Methods: swLDA and RF Feature Selection starts with testing all individual features (i.e., genes) and selects the one that provides the best classification quality (for the train...
Genomic Variation in NGS Data: Practical
What are Genomics Variations ? Genomic variation explains some of the differences among people, such as eye color and blood group, as well as whether a person has a higher or lower risk for gettin...
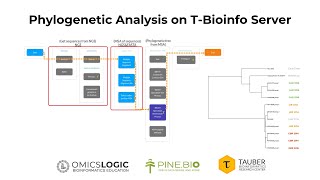
Phylogenetic Analysis
What is Phylogenetic analysis ? Phylogenetic analysis is the study of the evolutionary development of a species or a group of organisms or a particular characteristic of an organism. It is importa...
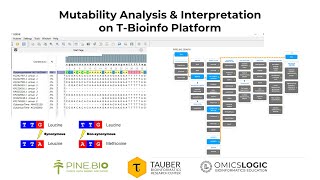
Mutability Analysis & Interpretation
What is mutability ? Mutability in simple terms describes the observed rate of a given position to change (or mutate). Frequency of change is calculated by a job called “Mutation-Call-Binom9...
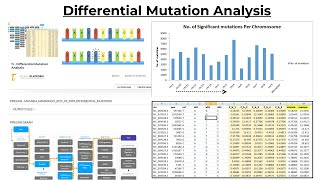
Differential Mutation Analysis
Differential Mutation Analysis Differential mutation analysis is a framework that uncovers cancer genes by comparing the mutational profiles of genes across cancer genomes with their natural germl...
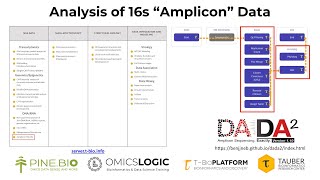
Analysis of 16s “Amplicon” Data using DADA2 Pipeline
The gut microbiome contains tens of trillions of microorganisms including at least 1000 different species of known bacteria. The mammalian gut microbiome has co-evolved with its hosts for hundreds ...
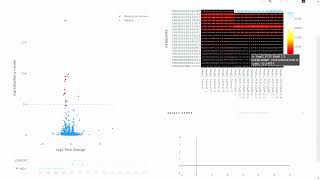
Differential Expression on T-Bioinfo Server
Identification of differentially expressed genes involves the identification of genes that are differentially expressed in disease. In pharmaceutical and clinical research, DEGs can be valuable to ...
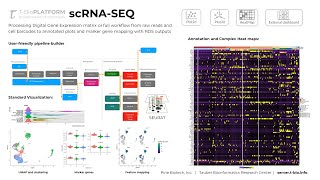
Dashboard & Results Obatined from Single Cell RNA-Seq Downstream Analysis
Single Cell RNA-Seq Data is being generated at unprecedented rates due to increasingly affordable and easy-to-use technologies like 10x Genomics. Moreover, increasing accuracy, algorithms for integ...
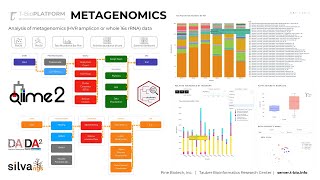
Metagenomic Data Analysis
Metagenomics Data Analysis is the study of microbial communities in their original communities. Approaches to study these communities allow for various levels of resolution and functional annotatio...
Dashboard & Results Obatined from Bulk RNA-Seq Data Analysis
RNA-Seq technology provides insights into how cells & tissues function by measuring the levels of gene expression. Since all normal cells within an organism possess the same genome, the differe...
Surveillance of SARS-COV-2 Variants of Concern (VOC) from wastewater samples
Project Overview Severe acute respiratory syndrome coronavirus 2 (SARS-CoV-2), the causative agent of COVID-19 pandemic, affected millions of people across the globe and resulted in more than thre...
Differentially Expressed Genes in Alzheimers
I n this project, we will explore transcriptomics (RNA-seq) data of advanced staged AD patients to identify what are those altered pathways. Here, first we will explore transcriptomics data of adva...
Changing Immune Response in Cancer
Project Overview Macrophages (white blood cells) represent an important component of the tumor microenvironment that includes the entire cellular environment surrounding the tumor and plays a comp...
Modeling Cancer Precision Medicine: Supervised Analysis
Breast cancer cases can be subdivided into distinct subtypes, and for the analyzed breast cancer cell lines Daemen et al. specified the associated subtype. In total, 52 analyzed cell lines include ...
Modeling Cancer Precision Medicine: Unsupervised Analysis
Precision Medicine promises to revolutionize the way patients are treated by using precise, molecular information that provides reliable indicators on effectiveness of treatment. This is useful bot...
EV-D68 and Acute flaccid myelitis in Kids
EV-D68 is a single-stranded positive-sense RNA virus belonging to the Enterovirus genus of the Picornaviridae family. EV-D68 infection usually leads to severe respiratory illness and has recently b...
Patient Derived Xenograft Models
This project uses data from the 2016 study by Bradford, James et al “Whole transcriptome profiling of patient-derived xenograft models as a tool to identify both tumor and stromal specific bi...
Factor Regression Analysis: TCGA Liver Cancer Project
From the Principal Component Analysis, it is clear liver cancer samples can be distinguished from breast cancer samples as well as from non-tumorous liver samples based on transcriptomics profiles ...
Principal Component Analysis: TCGA Liver Cancer Project
Hepatocellular Carcinoma (HCC) is a leading cause of cancer related deaths worldwide. Hepatitis viral infection, alcohol/cirrhosis, genetic predisposition (inherited) are among the major risk facto...

Ebolavirus: Deadly Mutations
We will study the evolutionary distance between different Ebola virus strains with the help of a sequence repository called NCBI Virus. Search by virus the Ebolavirus, taxid: 186536 and it will sho...

COVID-19 Origin & Pathogenesis of SARS-COV2
COVID19 stands for “CoronaVirus Disease” and 19 is the year this pandemic started, 2019. The pathogen causing this disease is the SARS-COV-2, Severe Acute Respiratory Syndrome Coronavir...
Tuberculosis Infection and Treatment
Infection with Mycobacterium tuberculosis is a major cause of human morbidity and mortality, and has wide-ranging clinical manifestations. While host factors, particularly T-cell-mediated i...
Breast Cancer Mutations:Oncogene Variant Calling
Breast cancer is the most common cancer among women worldwide, and with 521,900 deaths in 2012, also has the highest mortality (Torre, et al. 2015). In the United States, the overall five-year-surv...

Single Cell RNA-Seq: Lung Cancer (NSCLC)
Single-cell profiling methods are developed to dissect heterogeneity of cell populations. The study was performed on the lung adenocarcinoma samples from early-stage tissues to advanced sta...

Tumor Heterogeneity of Breast Cancer
The human body exhibits a diverse range of cells that undergo transit from one state to another in life (development, disease, and regeneration). Though derived from the same zygote, the ce...

Gut Microbiome Dysbiosis in Rett Syndrome
Rett syndrome is an X-linked neurodevelopmental disorder and one of the most common causes of intellectual disability in females. 90%–95% percent of cases are associated with mutations in the...
Role of High Fat Diet on Obesity
A high fat diet (HFD) can result in significant changes in gut microbial composition. A large number of studies to date are simply associations between HFD consumption, altered gut bacteria...

Libraries of Small Molecules Analysis – Curaxin
Cancer cells are able to acquire resistance to therapies with a single target; therefore multitargeted therapies provide the best chance for success for effectively treating cancer. Some conventi...